General Information
The PRSCO Conference took place in Bandung, Indonesia, from the 2nd till the 4th of July. More than 300 participants from 22 countries were counted. Stupendous organization and sympathy with a very good selection of papers, remarkable keynote speakers and involving social events namely the PRSCO Orchestra of Angklungs.
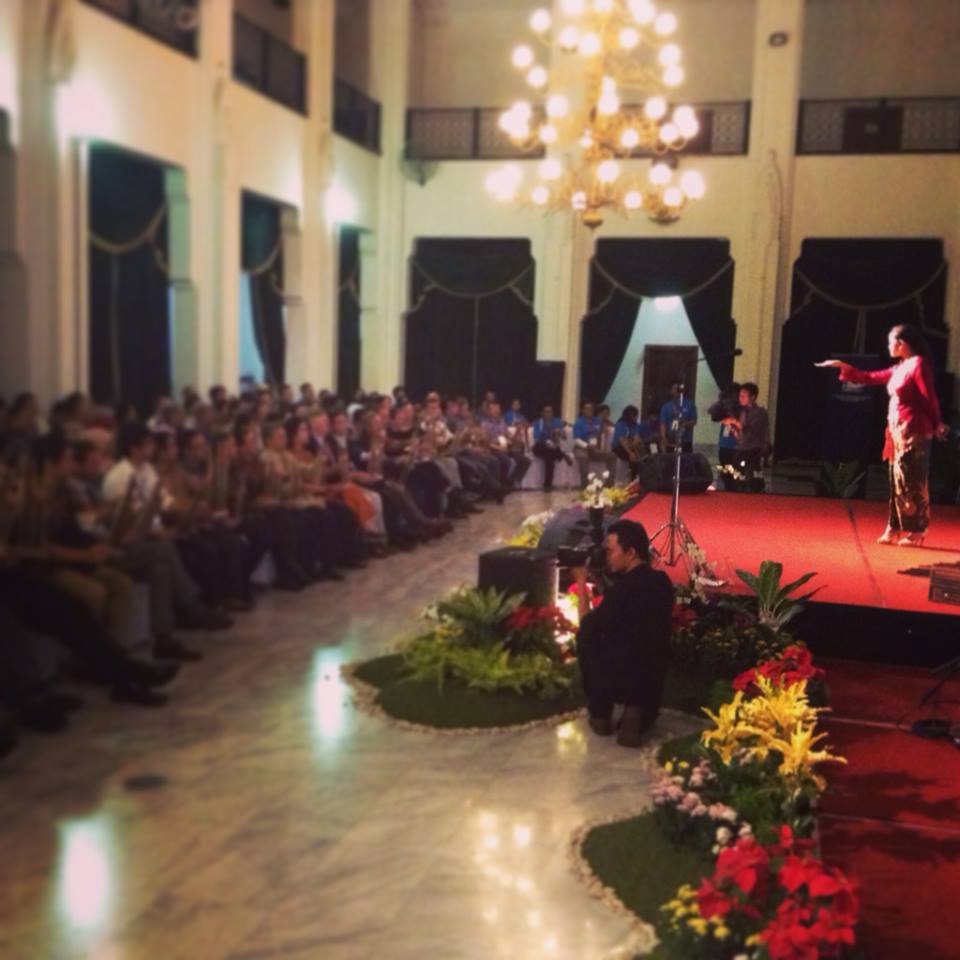
Regional scientists from 20 countries playing angklung in Gedung Sate, Bandung, Indonesia.
The presence of Prof. Armida Alisjahbana, Minister of National Development Planning for Indonesia, of Prof. Iwan Jaya Azis from the Asian Development Bank and of the Rector of Padjadjaran University, Prof. Ganjar Kurmia, among many other well-known regional scientists illustrates the desire of the organization and the participants to respond to global, Asian, national and regional challenges also within the consistent and flexible framework of regional science.
Revealing was the presence of a large number or young scientists with very interesting presentations. Also remarkable was the effective and kind support of the students of the Faculty of Economics and Business of the University of Padjadjaran indicating a very good academic environment. Congratulations to the students and to the Chair of the Local Organizing Committee, Dr. Mohamad Fahmi and to Dr. Nury Effenti, Dean of the Faculty of Economics and Business.

Synthesis of the Plenary Sessions
Entering the Uncharted Territory
Iwan J. Aziz – Head of the Office of Regional Economic Integration (OREI), Asian Development Bank and Professor at Cornell University, USA.
 “Asia is an irony. It has gone through a dramatic turnaround from excess investment during the pre-1997 Asian financial crises (AFC) to excess savings during the post AFC, including the rise of foreign reserve accumulation. Yet, the region is saving huge deficits in social and physical infrastructure….
….Unlike during the Pre-AFC, this time increased capital flows in Asia occur while the region has excess savings. This complicates the issues and poses major policy challenges. Not only gross flows become more important to track than net flows, but the size and types of flows matter a lot…
….The rising volatility of capital flows in the region has not been uniform, and bank-led flows occurred most frequently. This poses more difficult to maintain financial and macro stability…
… First, with a stronger currency as a result of capital inflows, the balance sheet position of borrowers improves, generating an even greater risk-taking in the part of banks and stimulating further inflows through cross-border bank led capital flows…
… Second, the global financial stability can be affected by competitive devaluation. This is the reason why the International Monetary Fund (IMF) needs to set the best course of direction in terms of the type and nature of intervention member countries can take….
…Third, there is a need for cross border bank regulation that has always discussed but progress has been close to none…
…Unlike the goods market, the financial market is a different “animal” , featuring complex interrelations with asymmetric information and high unpredictability that may generate seemingly non-rational decisions by agents…
…In short, the capacity of domestic safety nets needs to be augmented by regional safety nets. In ASEAN+3, the Chiang Mai Initiative Multilateral (CMIM) is already in place, and India has been leading the efforts to set up similar regional financial safety nets for South Asia, does this mean Asia has no reason to worry? Plenty of reasons…
… Financial crisis are explainable but not predictable. Does Asia need one to realize the danger of entering the uncharged territory?”
Socio-Spatial Dynamics of Economic Growth and Development
Jichung Yang – Professor at Seoul University, Korea.
 “There are many factors of economic growth and development: external trade, job creation, education, research and development spillover effects, industrial complexity….
….Regarding the social and economic spatial dimensions economic growth and development increases urbanization, reinforces the interactions between macro and micro levels of the economy, and interacts with the social-spatial dynamics recognizable in congested city infrastructures and cost disparities…
….Furthermore there are new phenomena that will have strong interactions with economic growth and development such as aging population, changing demand, political uncertainty and globalization…
Looking into the relations between urbanization and economic growth and more specifically urban structures and development it is possible to see, form the analysis of different urban agglomerations, that: sectorial clustering has a positive effect on productivity; proximity between companies of different sectors also have a positive effect on productivity; finally, entrepreneurship is also important regarding productivity…
On the other hand there are negative effects on growth such as economic recessions, insufficient job creation, low quality of housing, deceptive urban regeneration strategies…
Sustainable development strategies must be based in: i) stimulate innovation through increased agglomeration of companies beyond factor growth; ii) promote socially responsible investment; iii) coordinate and cure bureaucratic problems; iv) get involved in urban regeneration; v) intervene in the housing market; and vi) address the crises of the welfare state.”
Flying Carpets: transport and urban development
Piet Rietveld – VU University of Amsterdam, The Netherlands
 “Networks grow and fade away. That happened and continues to happen with sea, rail, telegraph, pipelines, road and air networks. Cities usually have more than one top situation along time and are more persistent than networks; nevertheless it is possible to have extreme cases of continuous city growth and monotonous city decline….
There is a long term decrease in costs of maritime transportation (Crafts and Veneables, 2001) and all transport costs have decreased substantially; according to the new economic geography model this has implication for the urban size with decreasing transport costs leading to increased urban concentration up to a point where decreasing transport costs can result in lower concentration of economic activity
According to (Anderson, 1986) there were four logistical revolutions: 1000-1500: reduction of transport costs and trade barriers lead to cities of 100000 inhabitants (Venice); 1500-1800: further reductions and innovations in baking stimulated cities of 800000 inhabitants (London); 1800-2000: even further reductions in transport costs also in land transport, and production technological innovations created cities of 10 million and more inhabitants (Shanghai).
The driving force of the fourth revolution is passenger transport. According to Colin Clark (1958) the internal transport within urban areas evolved influencing the city structure: …1800 – transport costs of agriculture products; …1850 – transport costs for workers; …1920 – trams and bicycles;… 1975 – car and buses; 1975…- stagnation in large cities. What is next: des-urbanization or re-urbanization?
What is the spatial range of agglomeration economies: within one building: walking, elevator; 500 m: walking; 2 Km: walking, cycling, car, public; 20 Km: public transportation, car; 100 Km: car, train; 500 Km: car, air. Furthermore, according to Rice and Veneables (2006) the effect on productivity of doubling working population within travel time is: 3,5% until 30 minutes; 1,5% from 30 to 60 minutes; 0,5% from 60 to 80 minutes; and 0% for more than 80 minutes.
In the last decade urban transportation is conditioning urban development. The importance of vertical transportation is underestimated in transport economics and urban economics. It is important to look at the value of high rising buildings. The safe elevator was invented by Elisha Graves Otis in 1852. The number of skyscrapers is booming (from 549 in 1970 to 9514 in 2010), spreading (from the US to the world) and becoming taller (Dubai, Burj Kalifa, 828 meters high, 2007).
For urban economics, skyscrapers result from the trade-off between costs of land and construction costs. There are three more reasons: agglomeration effects (internal returns within organizations and agglomeration effects between organizations); prestige and view. Based on hedonic framework analysis for three Dutch cities it is shown that building height is positively related to office rents but the marginal benefit decreases until 100 meters height increasing beyond that due to reputation effects. Concluding skyscraper construction is booming and height restrictions may have adverse economic effects and inefficient use of land.
The development of regional CGE modeling for policy analysis: an Australian perspective
Peter B. Dixon– Monash University, Melburne, Australia
 “Wassily Leontief (1936 & 1941) made two great contributions: The input-output table, and the input-output model that uses I-O table [X=(I-A)-1*Y]. CGE modeling [v1 = T*v2] is another form of modeling that uses the I-O table - Started with the work of Leif Johansen (1960) in Norway. CGE emphasizes behavior by individual agents, introduces resource constraints and substitution possibilities and price sensitive behavior.In Leontief’s world (the 1930s) there is high unemployment no upward pressure on prices of primary factors from extra demand. In Johansen’s world (the 1950s) there is full employment upward pressure on prices of primary factors from extra demand. The regionalization of IO and CGE models can be made top-down or bottom-up. This presentation shows two cases: i) One example of top-down CGE modeling: Removal of U.S. import restraints; ii) Another example on bottom-up regional modeling on the water buyback scheme for the Southern Murray-Darling Basin in Australia.
Top-Down Example: Work for the U.S. International Trade Commission by Dixon, P.B., M.T. Rimmer and M.E. Tsigas (2007). It was used an application of the 500-industry USAGE CGE model disaggregating the final demand for commodities facility (Si,s,d) using the Horridge formula, that takes account tradability of commodities, assigns large diagonals for major producers, off diagonals reflects distances between supply and demand regions and the share of supply regions in the national output. The exercise continued by trying to identify the variables that explain the employment results of the CGE model associated with the effects of removal of import restraints: a state index, the existence of ports and vacations (for states with touristic events) explained the results of the CGE. Winner states from the removal of import restrains would be in the US borders: the South and West of the US and also North of the Tennessee Valley.
In the Botton-up regional CGE modeling Each region treated as a separate economy. Commodities flow between regions in response to price signals. Labor and capital flow between regions in response to wage differences, employment opportunities, and profit opportunities. Bottom-up approach required when shocks alter relative costs across regions (Si,s,d) becomes endogenous, and regions have their own taxes, technologies, and resource constraints. The example refers to the assessment of the policy proposed by the Australian government to buy water rights from farmers in the Southern Murray-Darling Basin (SMDB). Model results generate interesting questions and sustain consistent answers: 1) Why does Buyback (and consequent increase in the price of irrigation water) stimulate production of vegetables? Because when water prices are high, growing Vegetables is a better use of irrigable land and water than growing other crops such as Rice. Why does Buyback have a relatively minor effect on farm output in an irrigation-intensive region such as R6 (0.6% contraction, 74% dependence)? Because Grapes and Fruit irrigation are major irrigation industries in Region 6 and these are not as badly effected by Buyback as Rice and other irrigation crops which are barely represented in Region 6. Furthermore, increase in the price of water reduces the rental value of irrigable land.
Notes taken by Tomaz Ponce Dentinho